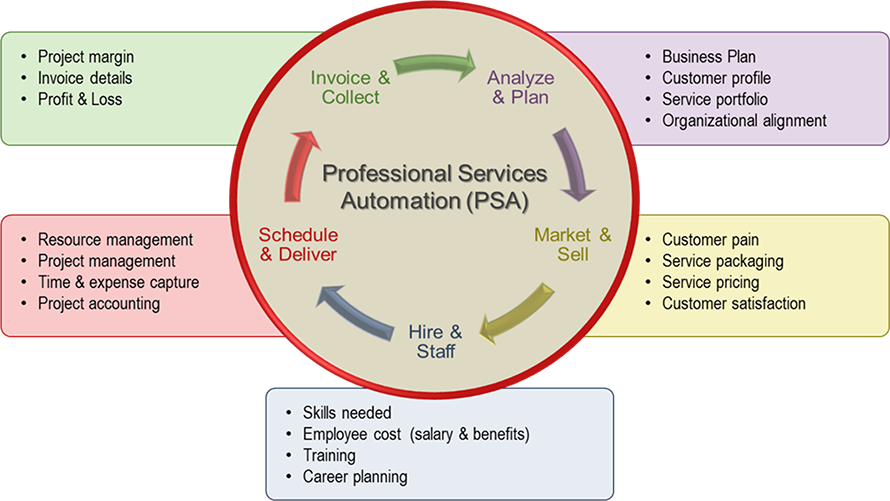
According to a new study published by the leading professional services think tank, Service Performance Insight (SPI) which analyzes results from more than 250 management and IT consultancies, the most profitable consulting firms run their business on an integrated professional services automation (PSA) solution.
These firms increased their EBITDA by 6.2 percentage points, improving their profit margins by 56%.